The pay-per-call numbers to watch every week
Pay-per-call metrics are the few numbers that show whether your calls are usable, answered, long enough to count and profitable.
Check a short list once a week, by traffic source. A traffic source, also called a publisher, is whoever sends you the calls. A buyer is the business that receives and pays for them.
This page gives the math for each number and where to look for it in TrackDrive. Where TrackDrive's pages name no field, the math is marked as your own.
Four numbers to check first
TrackDrive's masterclass names four numbers to watch every week.
Qualified rate is qualified calls divided by total calls. It shows how much of your traffic is usable.
If it falls, look at the traffic, the filters or the rules.
Billable rate is calls that reach billable duration divided by answered calls. Billable duration is the minimum talk time before a call becomes payable.
A drop can mean callers hang up early, or the buyer's team is having trouble connecting.
Revenue per call is total revenue divided by total calls, including the calls that didn't qualify. It reflects both quality and price, so it's a strong single number for comparing sources.
Margin is revenue minus payout, as a percentage of revenue. Revenue is what the buyer pays for a call, and payout is what the publisher earns.
If you sell your own calls with no network, use revenue minus your cost of generating them.
TrackDrive tracks these earnings; it never pays anyone.
Five numbers that explain a move
These help you find the reason when one of the first four shifts.
Answer rate is answered calls divided by the calls sent to a buyer. A drop can mean a buyer is closed, full or slow to pick up.
TrackDrive's pricing also has a per-call surcharge tied to unanswered attempts. It applies when too many call attempts are abandoned, meaning 0-second and unanswered, during the last 30 days.
The pricing page has the rate and the threshold.
Conversion rate is conversions divided by calls. A conversion is whatever the offer defines as a success, such as a sale, a qualified lead or a booked appointment.
Short-call share is calls under a length you choose, divided by total calls.
Duplicate rate is duplicate calls divided by total calls. A duplicate is the same caller arriving again inside a window your deal sets.
In TrackDrive's buyer conversion settings, that window is the duplicate timeframe. Bad calls and fraud in pay per call covers what to do about them.
EPC, or earnings per call, is earnings divided by calls.
If you're the publisher, earnings means payout. If you sell calls to buyers, it means revenue.
The checklist, and where to look for each number in TrackDrive
"Your own arithmetic" means the TrackDrive pages linked here don't name that figure. You work it out from counts they do show.
| Number | The math | Where it is in TrackDrive |
|---|---|---|
| Qualified rate | Qualified calls ÷ total calls | No named field. Your own arithmetic: Calls By Category can count calls by disposition or token, set per offer. Count the ones you treat as qualified, then divide. |
| Billable rate | Calls past billable duration ÷ answered calls | No named field. Your own arithmetic: when a buyer's conversion fires on duration, conversions ÷ connected calls is a rough guide. A conversion's own hours or duplicate timeframe can hold it back. |
| Revenue per call | Total revenue ÷ total calls | Named as RPC, the usual shorthand for revenue per call, among the figures summary reports can group. Its page doesn't give the formula, so check it against your own math. |
| Margin | (Revenue − payout) ÷ revenue | Each call's margin is in the call log. The percentage across many calls is your own arithmetic from revenue and payout on the dashboards. |
| Answer rate | Answered calls ÷ calls sent to a buyer | No named field. Your own arithmetic: connected calls ÷ the calls sent to a buyer. The Classic Dashboard shows connected and total calls for the current date; it doesn't say whether total calls counts only calls sent to a buyer. |
| Conversion rate | Conversions ÷ calls | Named on the Classic Dashboard, for the current date. Its help article doesn't give the formula, so compare it only with itself. |
| Short-call share | Calls under your length ÷ total calls | Your own arithmetic: Calls By Category can count calls by duration. |
| Duplicate rate | Duplicate calls ÷ total calls | No named report. Your own arithmetic: the calls API can list calls that were duplicates against a buyer's or a traffic source's conversion settings. |
| EPC | Earnings ÷ calls | No EPC report is named on the pages linked here. Your own arithmetic: divide revenue or payout by calls. Buyers can also be ranked by historical EPC. |
One note on that last row. A buyer's route-by type can be EPC, and EPC routing puts the buyers with the highest historical EPC first. That is a routing setting, not your weekly figure.
One invented week, worked through
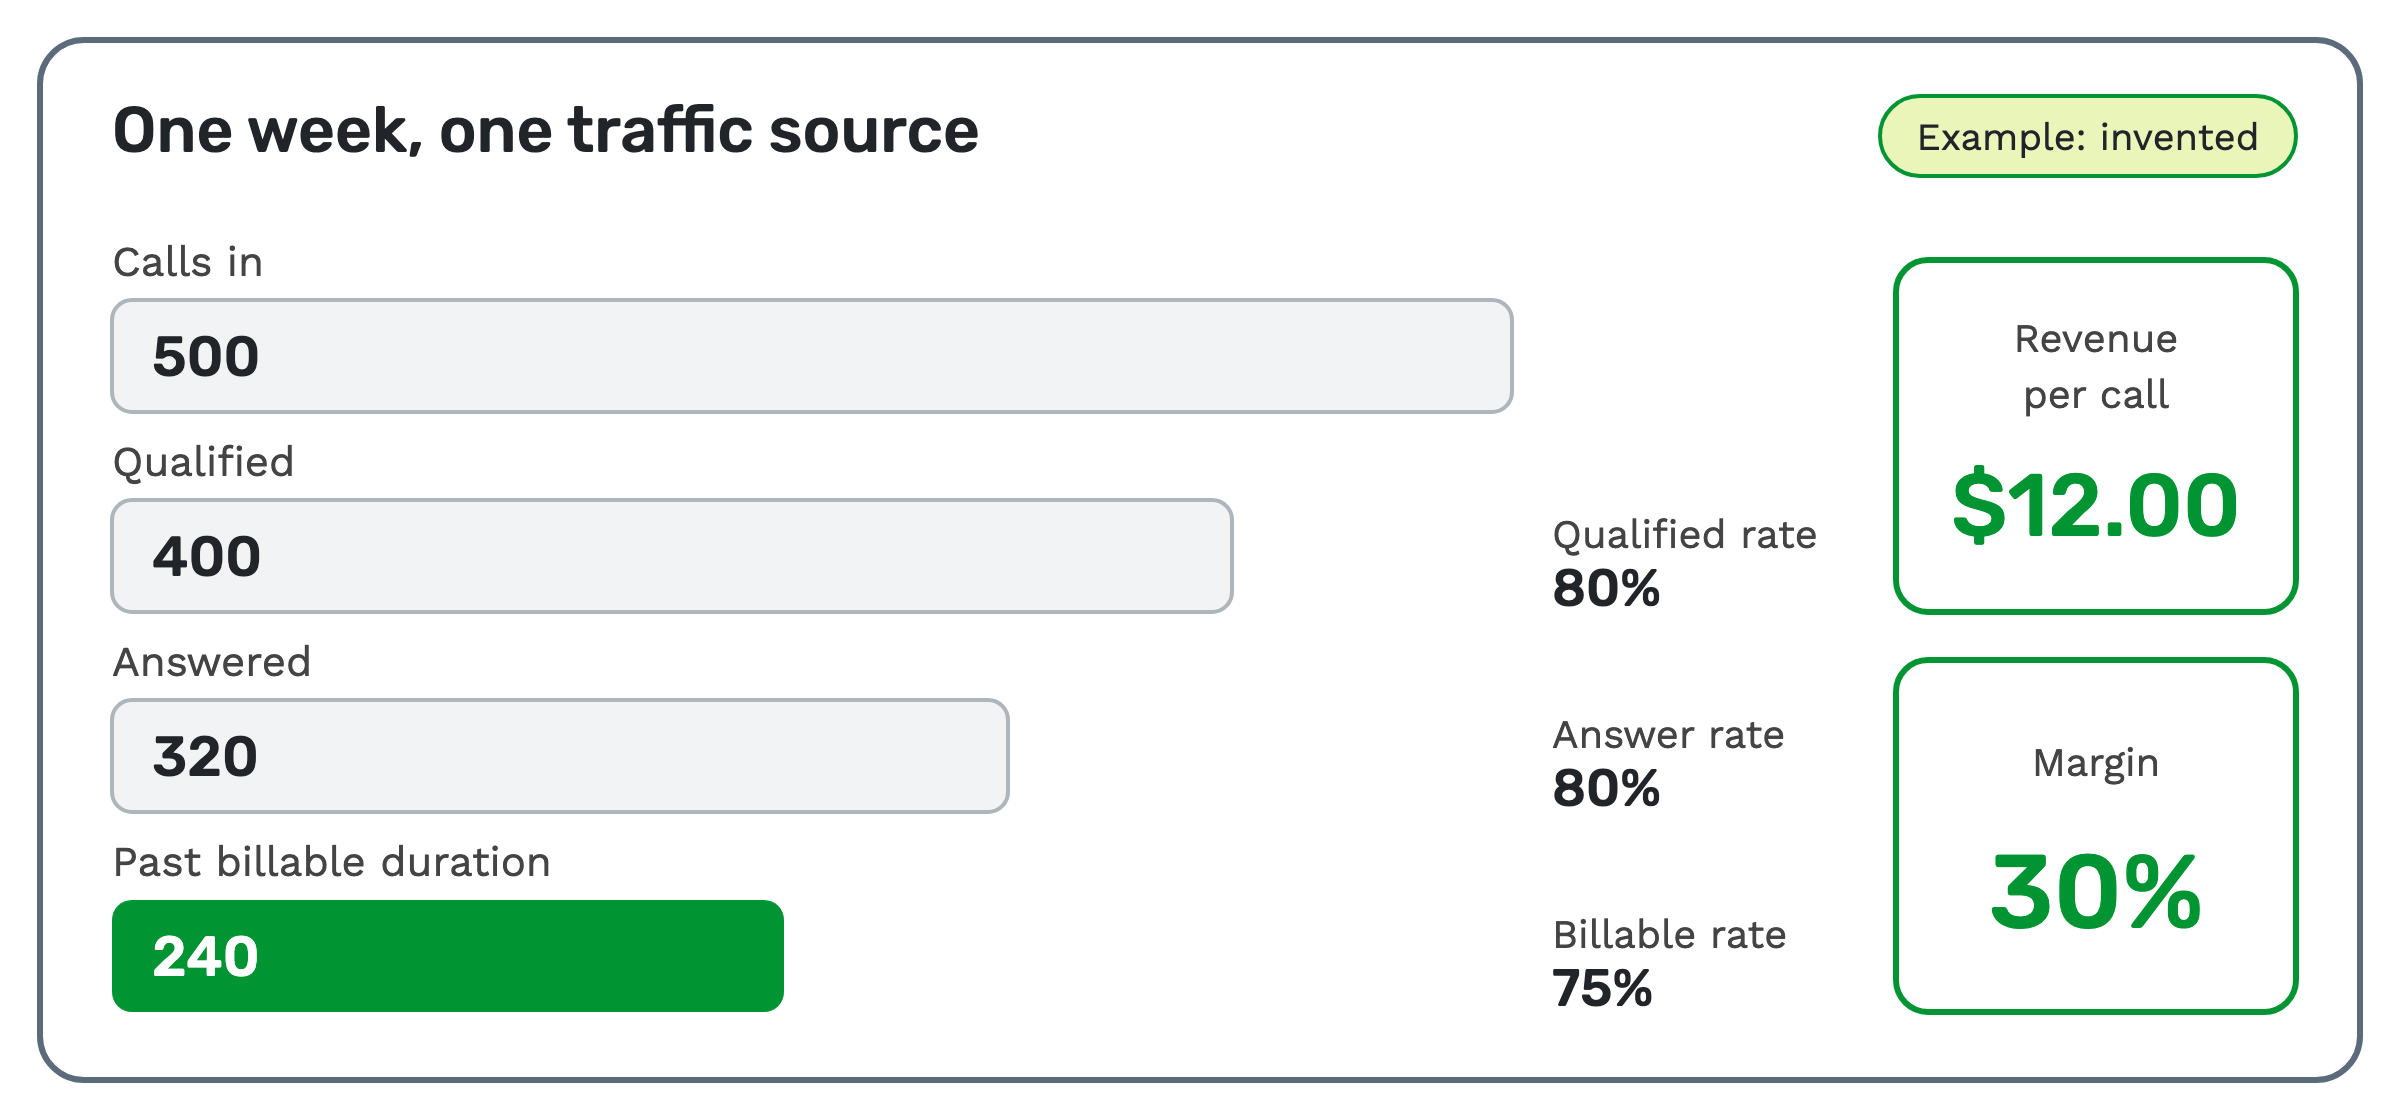
Every figure in this section is invented, to show the arithmetic on one traffic source.
- In this invented week, 400 of 500 calls qualified, a qualified rate of 80%.
- Of those 400 calls sent to buyers, an invented 320 were answered, an answer rate of 80%.
- An invented 240 of the 320 passed billable duration, a billable rate of 75%.
- Invented revenue of $6,000 across all 500 calls is $12.00 revenue per call.
- Invented payouts of $4,200 leave $1,800, a margin of 30%.
Where the numbers live in your call tracking dashboard
TrackDrive has several reporting surfaces, each for a different job.
- Analytics Overview. The default page after login. You arrange widgets such as metric cards, charts and tables, and set each one's data source, filters and date range. Layouts are per user.
- Classic Dashboard. Total calls, connected calls and average duration, plus total conversions, conversion rate and revenue, for the current date. It also charts volume and revenue over time, and the reporting overview calls its metrics real-time and historical.
- Summary reports. Live dashboards and summary reports cover calls, conversions, revenue, payout, cost and profit. Reports group them by buyer, traffic source, offer, status and dozens of other dimensions.
- Call log. Every call, with its source, offer, buyer, timings, geography, custom tokens, revenue, payout and margin.
- Calls By Category. Your own categories, set per offer, based on things like duration, disposition, buyer, geographic origin or token values.
- Buyer Analytics. Buyer availability, cap utilization and recent call volumes. A cap is a limit on how much a buyer takes. This page refreshes on load or by hand.
- Data exports. Calls to CSV, once or on a schedule, with your own columns, date range and filters. Use one when a week's count isn't on a dashboard.
For inbound call analytics, most dashboard numbers update within seconds of the event. Ping-post traffic gets its own live dashboard.
Between reviews, Monitors & Alerts can notify you when buyers don't answer, or when calls run shorter than a length you set. An alert can also pause the item it watches.
Your own trend is the benchmark
This page gives no target for any number. A good answer rate depends on your vertical, your hours and your buyers.
Compare each number with its own last few weeks, on the same view and the same date range. A change from your own recent weeks is the signal worth acting on.
When a number drops, check in this order
Work through four checks, one at a time. The first ones are the quickest to check and the most common causes.
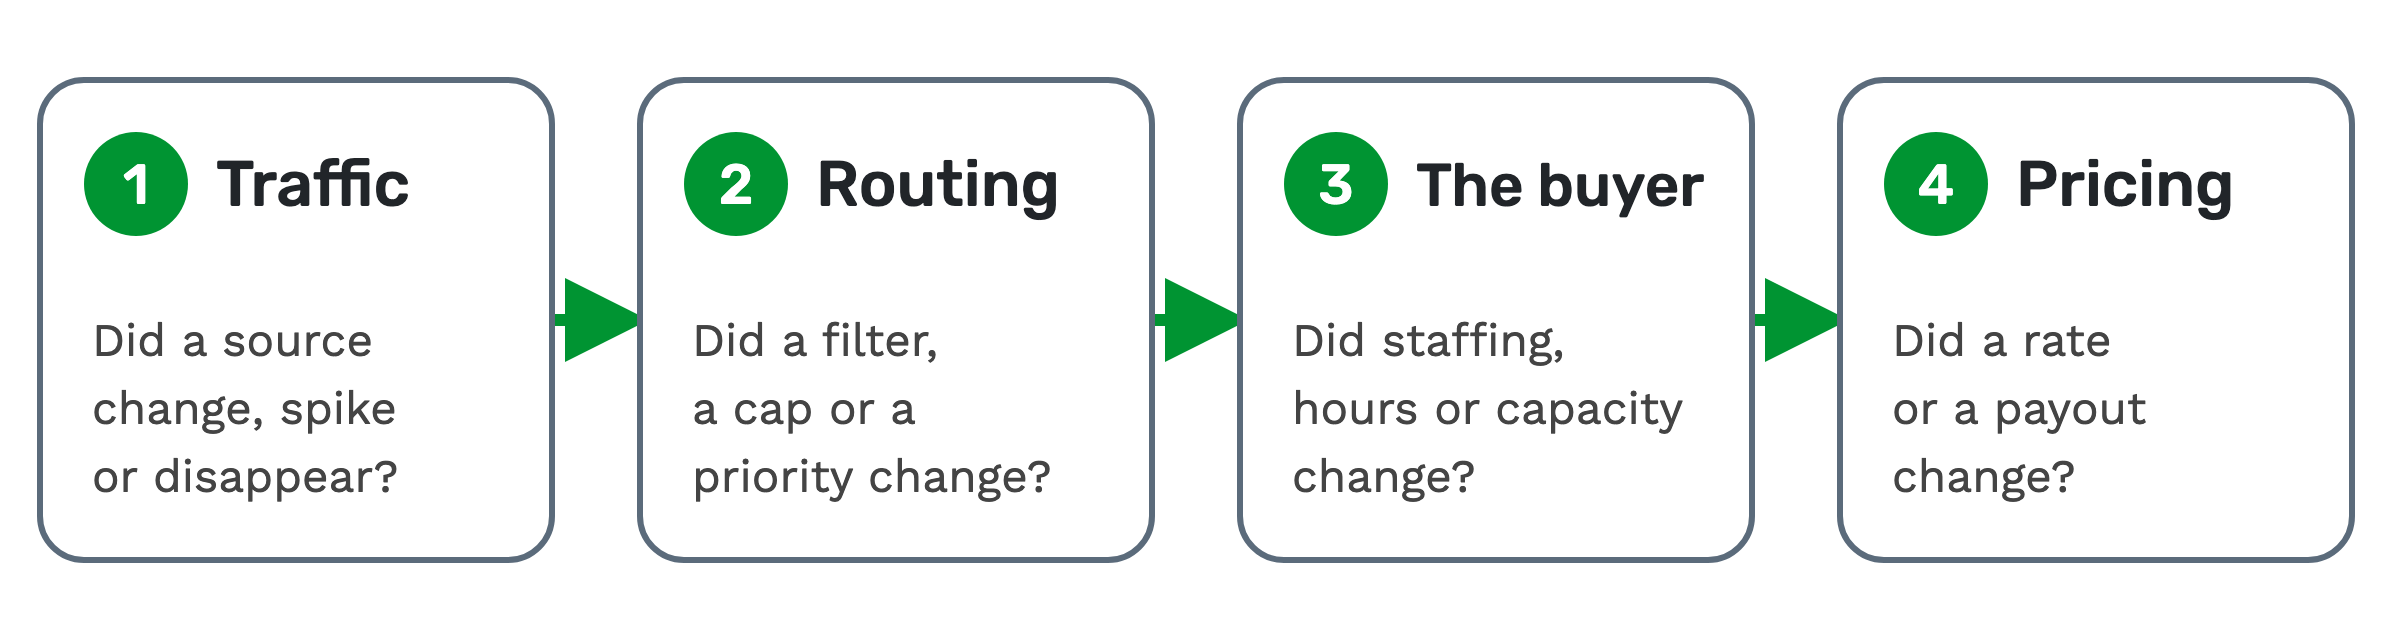 1. Traffic. Did a source change, spike or disappear?
2. Routing. Did a filter, a cap or a priority change? See how to route inbound calls.
3. The buyer. Did staffing, hours or capacity change? Buyer caps and concurrency explains the limits.
4. Pricing. Did a rate or a payout change?
Change one thing at a time. If you change three, you won't know which one made the difference.
The weekly review
Once a week, review the numbers by traffic source and by sub ID. A sub ID is an extra tag that tells you which ad, page or placement sent the traffic.
TrackDrive's help centre says a sub ID sent with a lead rolls up into "source/sub-source breakdowns on the reporting dashboards". The API also lists a sub ID on each call, and its Data Exports call can filter by it.
Then share what you found with your buyers and publishers, and act on it. Send more volume to sources that perform, and tighten or pause the ones that don't.
Write down what you changed, so next week shows the effect.
Calls you're disputing belong in the same review. Call scrubbing explains what that means, and call dispositions explain how outcomes get labelled.
If you use AI scoring or transcription
Both are add-ons, so these numbers exist only where you've turned them on. Post-call transcription is an opt-in premium service on an offer.
AI call scoring is an add-on to transcription, billed only on transcribed minutes, for the offers you turn it on for. A call gets a 0 to 100 score whenever a question applies.
Where scoring is on, its dashboard shows average score, critical-fail rate and each question's pass rate. Transcription analytics show volume, sentiment mix, talk ratio, minutes and cost. See call quality scores for more.
Questions people ask
Which pay-per-call metrics matter most? Start with qualified rate, billable rate, revenue per call and margin. Use the other five to explain a change.
Does TrackDrive show all of these as named fields? No. Its pages name conversion rate, RPC and each call's margin, and EPC as a routing setting. Your weekly EPC and the others are your own arithmetic from the counts it logs.
What is a good answer rate or billable rate? This page gives no figure. Use your own trend, by traffic source, as the benchmark.
What's the difference between EPC and revenue per call? Both divide money by calls. Revenue per call uses revenue. EPC uses your earnings, which for a publisher means payout.
Does TrackDrive pay publishers? No. TrackDrive tracks earnings; it never pays anyone.
See it in action
Request a demo for a live walkthrough tailored to your use case, or start free, with no credit card and no onboarding fee.